Free Printable Psychometric Conversion Table In PDF Format

Understanding test results can feel confusing, especially when you see numbers and terms like percentile, Z-score, or T-score. That’s where this psychometric conversion table we built helps. Think of the table as a cheat sheet that makes complicated measurements easy to follow. Instead of trying to calculate scores on your own, you can use this ready-made chart. The best part? You can download three different free printable versions to keep handy as a quick reference. Whether you need the table to print for school, work, or personal curiosity, this chart simplifies the process in seconds.
How Does The Psychometric Conversion Table Work?
A psychometric conversion table looks full of strange terms, but the chart is easier than it seems. Each score shows a different way to measure performance, and our free printable cheat sheet helps you keep track.
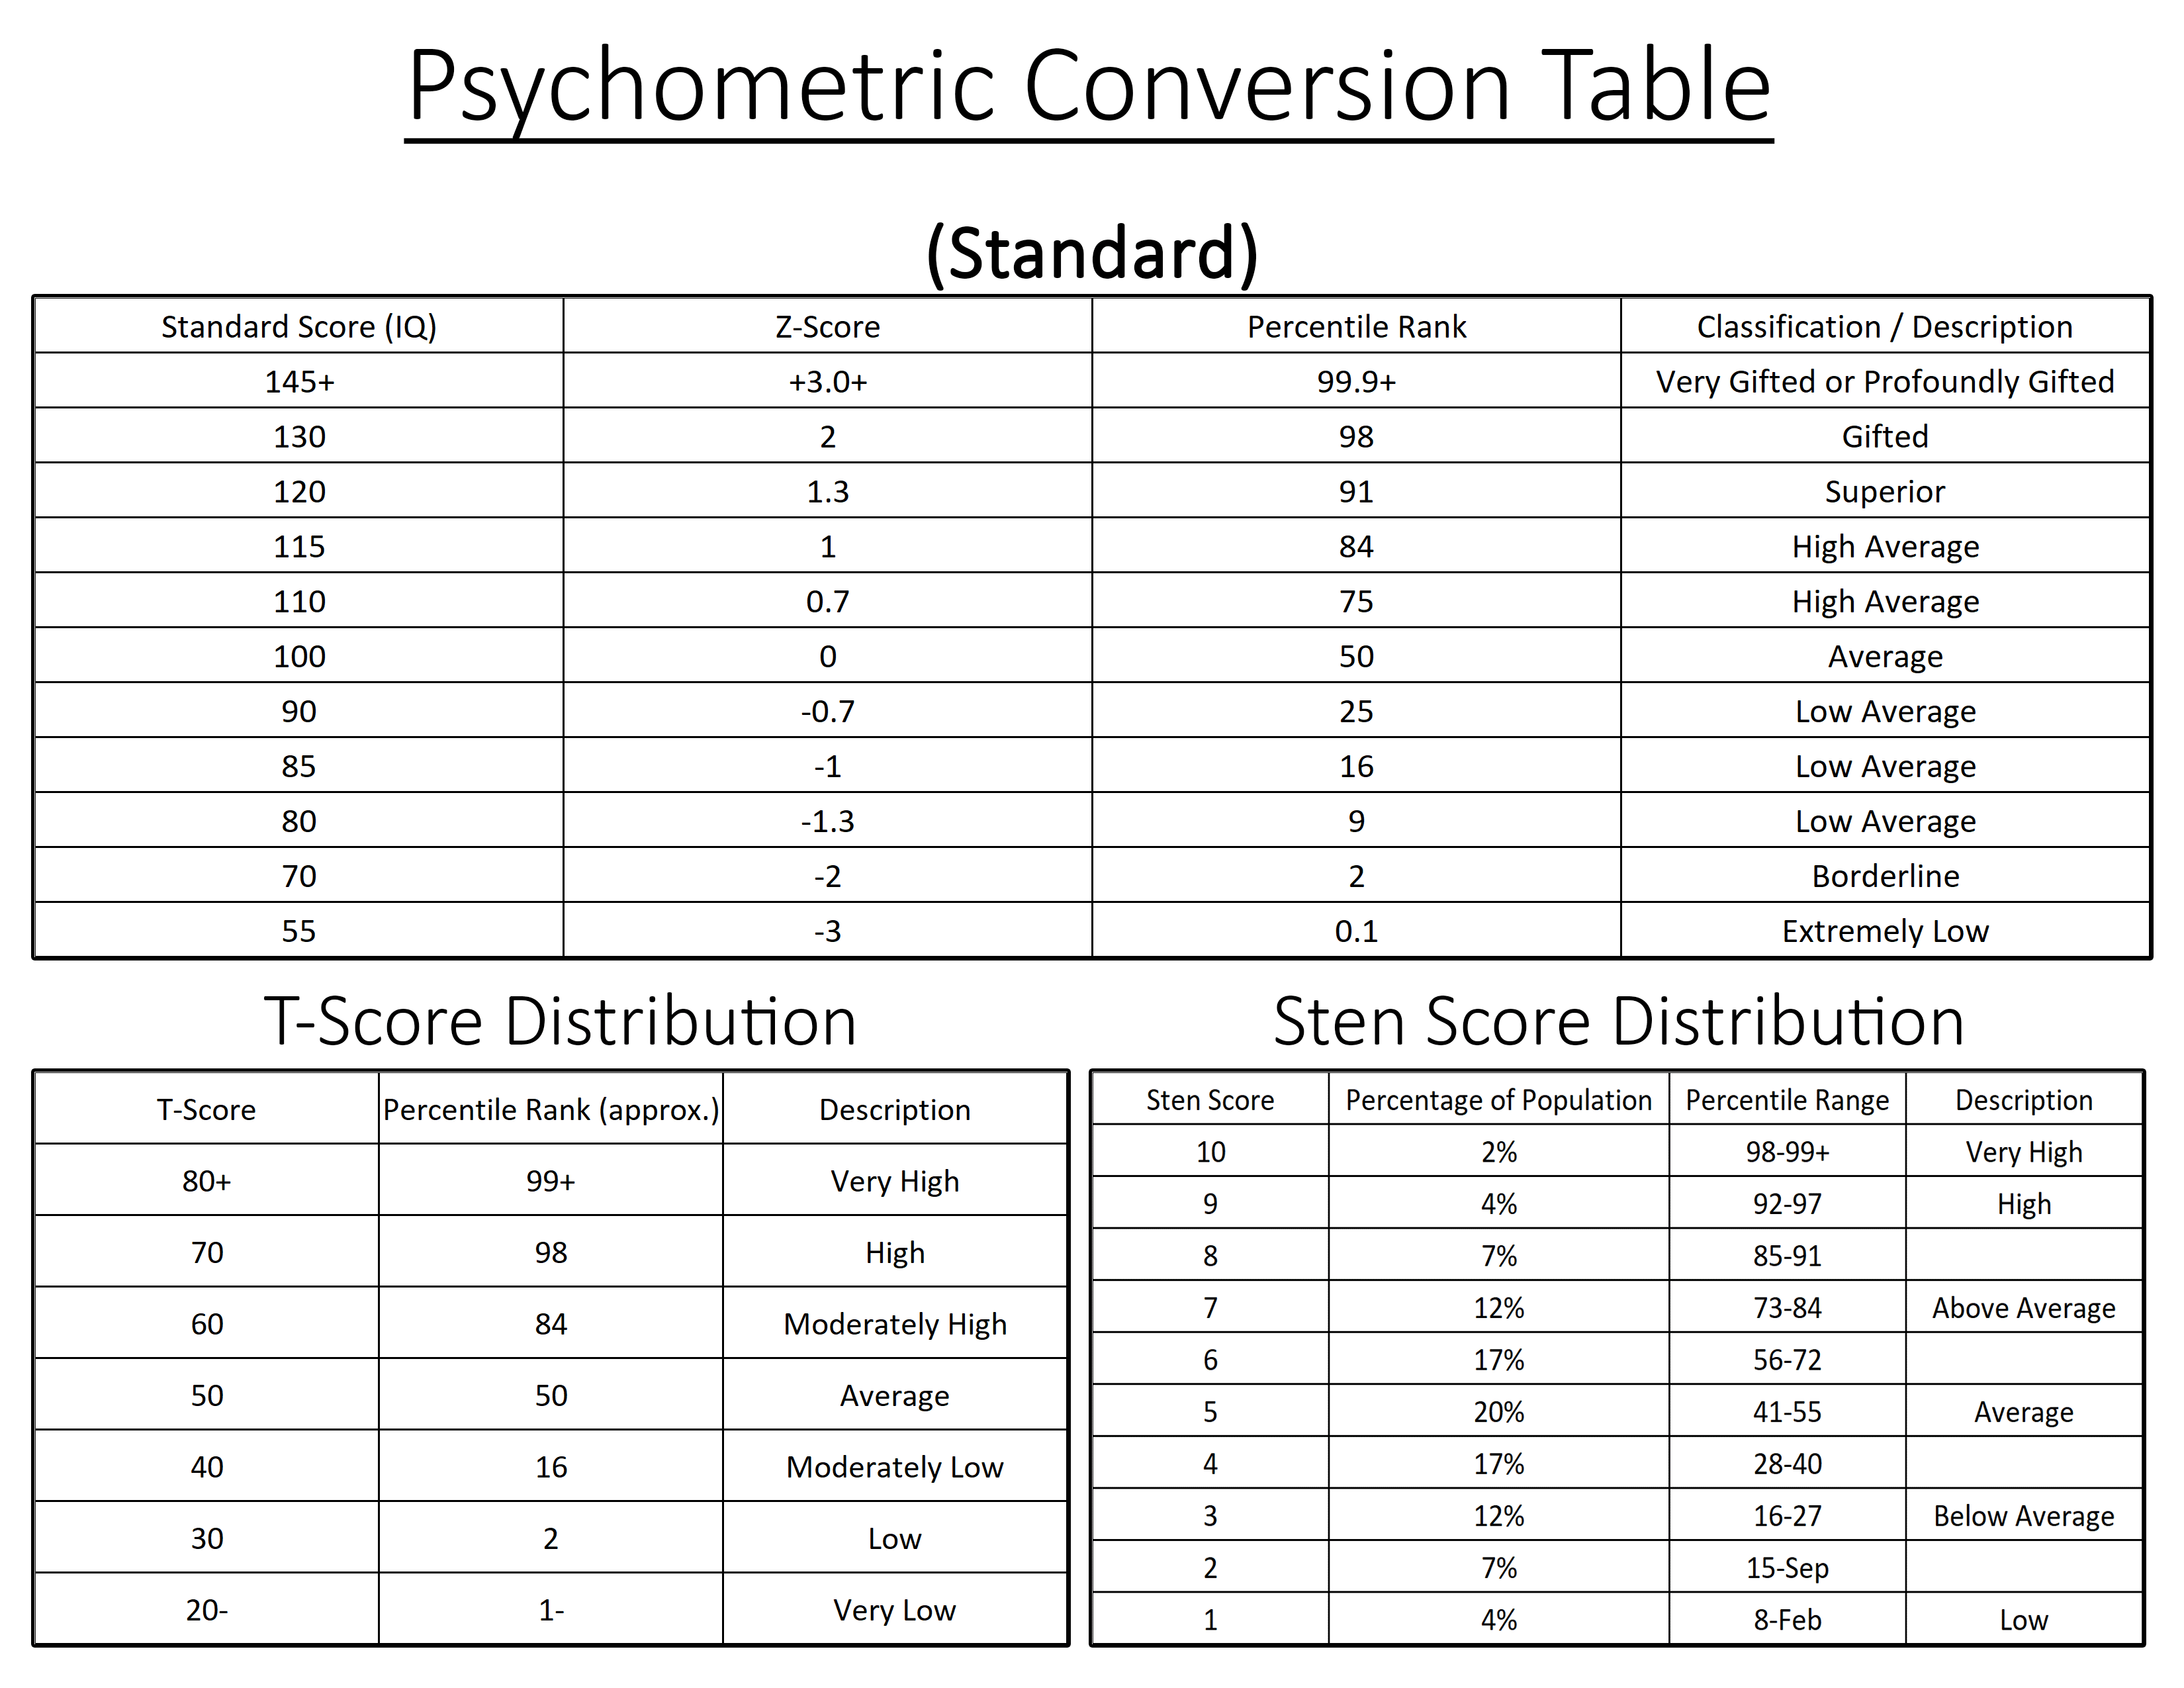
- Standard Score (IQ): This is the classic number. The average measurement is usually 100.
- Z-Score: This number shows how far from the average you are. A zero means average, a positive score is above, and a negative score is below.
- Percentile Rank: This part of the table compares you with others. For example, a 90th percentile rank means you did better than 90 percent of the group.
- T-Score, Sten Score, Scaled Score: These are other conversion methods. Each one has its own table, but all lead to the same result: a clear view of where the measurement falls.
Here’s a simple example. Imagine someone scores a Z-score of +1. That means their result is one step above average. On the chart, this converts to a standard score of 115 and places them in the 84th percentile. Our free PDF cheat sheet makes this type of conversion easy to calculate without confusion.

Everyday Uses Of Our Psychometric Conversion Chart
A psychometric conversion table isn’t just for exam rooms; it pops up in all kinds of places. Teachers use the table to calculate grades more fairly, psychologists use the chart to interpret test results, and HR teams rely on our printable PDF cheat sheet to compare candidate scores. Having this conversion chart to print or download means you can quickly check measurements without digging through long reports. Whether it’s in education, research, or hiring, the table saves time and keeps things clear.
Download Our Useful Psychometric Conversion Chart Printable For Free

You can download our psychometric conversion tables to print and keep the charts handy for quick reference. These PDF versions make it easy to use anytime. Our free cheat sheet or table helps you calculate scores without mistakes. These charts are simple and clear, showing every measurement conversion you need. Once you have the printable version, you can use the table at home, in the office, in class, or download the PNG version on your devices. Having these psychometric conversion tables saves time and keeps your results accurate every time.
- Download the psychometric conversion tables for free in PDF and PNG formats below:
– Printable psychometric conversion chart (mixed colors): PDF – PNG
– Psychometric conversion table with T-score and Sten score separated into different sections: PDF – PNG
– Black-and-white psychometric conversion cheat sheet: PDF – PNG
I’m a passionate designer with a keen eye for detail and a love for crafting visually stunning experiences. With a strong foundation in design tools like Adobe Photoshop, Illustrator, and Figma, I bring ideas to life through compelling visuals. My proficiency in HTML and CSS allows me to translate designs into functional, responsive websites. I’m always eager to learn and explore new design trends and excited to contribute my skills to innovative projects.